Average Bicycle Speed: Benchmarks, Influencing Factors, and Improvement Strategies
Explore the average bicycle speed across terrains, rider types, and conditions. Learn how to measure, interpret, and safely improve your pace with practical, data-backed guidance from BicycleCost.

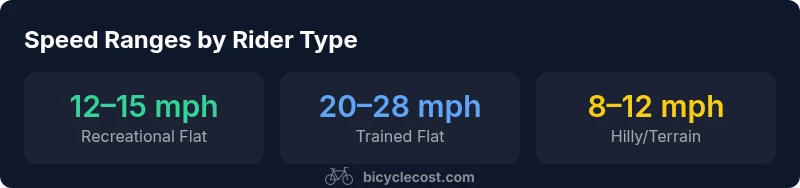
On flat ground, recreational riders typically cruise at 12–15 mph (19–24 km/h), while trained cyclists can average 20–28 mph (32–45 km/h) during sustained efforts. Terrain, wind, and cadence shift these numbers, so use consistent measurement for progress. According to BicycleCost Analysis, 2026, actual speeds vary with fitness, equipment, and riding goals.
Why average bicycle speed matters
Knowing the concept of the average bicycle speed helps riders set realistic goals, plan training, and compare performance over time. It is not a single fixed number; rather, it reflects how a cyclist, on a given day, under specific conditions, performs over a route. For everyday riders, the speed you see on a commuting ride tells you about pace management, cadence, and the effort you’re willing to invest. For athletes, it provides a benchmark to tune training zones, monitor progress, and structure workouts. BicycleCost analyses consistently show that the same rider can average notably different speeds across flat roads, hills, and weather conditions. Tracking your own pace with consistency is the most reliable way to interpret improvement over weeks and seasons.
The average bicycle speed also interacts with safety and efficiency. Riding faster increases air resistance nonlinearly, which means marginal gains require greater power input. This is why speed isn’t an end in itself; it should be pursued in a controlled, risk-aware manner that prioritizes braking, signaling, and road awareness. In practical terms, riders should measure speed over several rides on similar routes to minimize noise from day-to-day variability.
How speed is measured and what affects it
Speed is measured most reliably with a device that records distance and time over a defined segment. Common tools include GPS bike computers, smartphone apps, and power meters that help separate pace from power output. Important factors affecting average speed include cadence (pedal revolutions per minute), gearing, weight, and aerodynamics. Terrain plays a major role: smooth, flat surfaces invite higher speeds, while short, steep climbs dramatically reduce pace. Weather also changes performance: headwinds slow you down, tailwinds can boost you, and rain may increase rolling resistance. Finally, fatigue, nutrition, and sleep influence how close your effort aligns with your target pace.
Common speed benchmarks by rider type
Benchmarks vary by rider type, training, and environment. Recreational riders on flat pavement often sit in the 12–15 mph range, while casual commuters might stay around 12–18 mph depending on route choice and stop frequency. Competitive or well-trained cyclists frequently reach 20–28 mph on sustained flat segments, with experienced racers capable of higher averages on time trials. It’s important to note that personal bests and average speeds are best interpreted relative to route difficulty, ride length, and pacing strategy rather than as a single unchanging score.
Factors that influence average speed (terrain, wind, bike, rider)
A wide set of variables determines your average speed. Terrain type and gradient directly affect pace: flat sections yield higher averages, whereas climbs and rough surfaces reduce it. Aerodynamics matters; a rider's posture and clothing can slightly affect speed through reduced drag. Bike condition and component choices—such as tire width, tread, and inflation—also play a role. Weight distribution, gear selection, and cadence influence how efficiently you translate power into forward motion. Weather, especially wind direction and speed, can either help or hinder your progress dramatically. Finally, fitness level and training history shape how well you sustain higher paces over a ride.
How to improve average bicycle speed safely
Improvements come from a mix of training, technique, and equipment optimization. Start with a structured endurance plan that gradually increases weekly mileage and includes interval sessions to build power. Work on cadence consistency and efficient pedal technique to convert more effort into speed. Regular bike-fit assessments ensure you aren’t wasting energy through poor posture or misaligned components. Simple equipment tweaks, like proper tire pressure, narrower tires for reduced rolling resistance, and cleaner drivetrain maintenance, can contribute to speed gains without increasing risk. Safety remains paramount: practice on safe routes, use appropriate protective gear, and ride predictably to maintain control at higher speeds.
Data interpretation and caveats
When interpreting speed data, consider the context of each ride. A single fast sprint does not define overall performance; averages built from multiple rides across similar routes provide the most meaningful insight. Remember that different routes, traffic conditions, and weather will produce different averages. If you want to compare across riders, normalize for route length, terrain type, and weather to avoid drawing misleading conclusions. Data interpretation becomes more robust when you document ride conditions and use consistent timing windows for calculating averages.
These sections collectively help you understand how the average bicycle speed behaves under real-world conditions, and how you can approach improvement in a measured way.
Everyday scenarios: commuting, training, and triathlons
Commuting cycles rely on consistent, sustainable pace rather than peak speed. For daily trips, a practical target is maintaining a steady 12–15 mph on flatter corridors, increasing only when traffic and signals permit. Training riders may structure sessions around tempo zones that correspond to specific speed bands, using data to adjust for fatigue and recovery. In endurance events like triathlons, shifts in speed reflect a blend of aerobic capacity, pacing strategy, and nutrition. Regardless of scenario, having a realistic, data-backed target for average speed helps align training with goals and facilitates safer, more enjoyable rides.
Practical tips and routines to measure your own average speed
- Measure over at least 3–5 repeated rides on similar routes to dampen day-to-day fluctuations.
- Use an app or device that records distance, time, and cadence, and export data for trend analysis.
- Schedule regular check-ins to adjust targets after gains in fitness or changes in equipment.
- Pair speed work with proper recovery so you don’t overtrain or risk injury.
- Ensure your bike fits well and you’re comfortable in your riding position to minimize energy losses.
Speed benchmarks by terrain and conditions
| Terrain | Avg Speed (mph) | Avg Speed (km/h) | Notes |
|---|---|---|---|
| Flat paved | 12–15 | 19–24 | Common recreational pace on smooth roads |
| Rough/gravel | 8–12 | 13–19 | Terrain adds rolling resistance and control challenges |
| Hilly terrain | 5–9 | 8–14 | Steep grades reduce speed substantially |
| With headwind | 10–18 | 16–29 | Wind direction and strength shift pace |
People Also Ask
What is the average bicycle speed on flat terrain?
On flat terrain, recreational riders commonly average about 12–15 mph (19–24 km/h), while trained cyclists can reach 20–28 mph (32–45 km/h) during sustained efforts. Variability comes from rider fitness, gear, and cadence.
On flat ground, most riders sit around twelve to fifteen miles per hour, and trained cyclists can push into the high teens or twenties.
How does terrain affect speed?
Terrain has a major impact: hills and rough surfaces reduce pace, while smooth, flat routes support higher averages. Slopes, surface quality, and turn frequency all shape your overall speed.
Terrain really changes speed—hills slow you down a lot, smooth flats let you go faster.
How can I measure my average speed accurately?
Use a GPS bike computer or smartphone app to track distance and time. Ride on consistent routes, log multiple sessions, and normalize for distance to compare progress.
Track your rides with a GPS computer, ride the same routes, and compare your averages over time.
Is speed the best measure of cycling performance?
Speed is one metric, but endurance, power, efficiency, and consistency are equally important. A well-rounded approach yields more meaningful progress than chasing a single number.
Speed matters, but endurance and power matter too—focus on the bigger picture."
What safety considerations affect speed?
Higher speeds require better braking, greater situational awareness, and quality protective gear. Always prioritize safe riding practices and legal road rules over chasing faster times.
Go for speed, but safety comes first—watch for traffic and wear proper gear."
Can I improve speed safely without increasing risk?
Yes. Build a structured training plan, optimize your bike fit, perform regular maintenance, and gradually increase intensity. Avoid sudden, risky attempts.
Train progressively, keep your bike in top condition, and don’t push beyond your comfort zone.
“Speed is a product of effort, terrain, and pacing. By understanding these factors, riders can set realistic goals and track meaningful improvements.”
Quick Summary
- Measure speed over several rides for accuracy
- Use consistent routes to track progress
- Tailor training to improve pace with safety in mind
- Bike fit and maintenance influence speed more than you might think
- Weather and terrain dramatically affect averages — plan accordingly